General documentation
Contents
New user registration
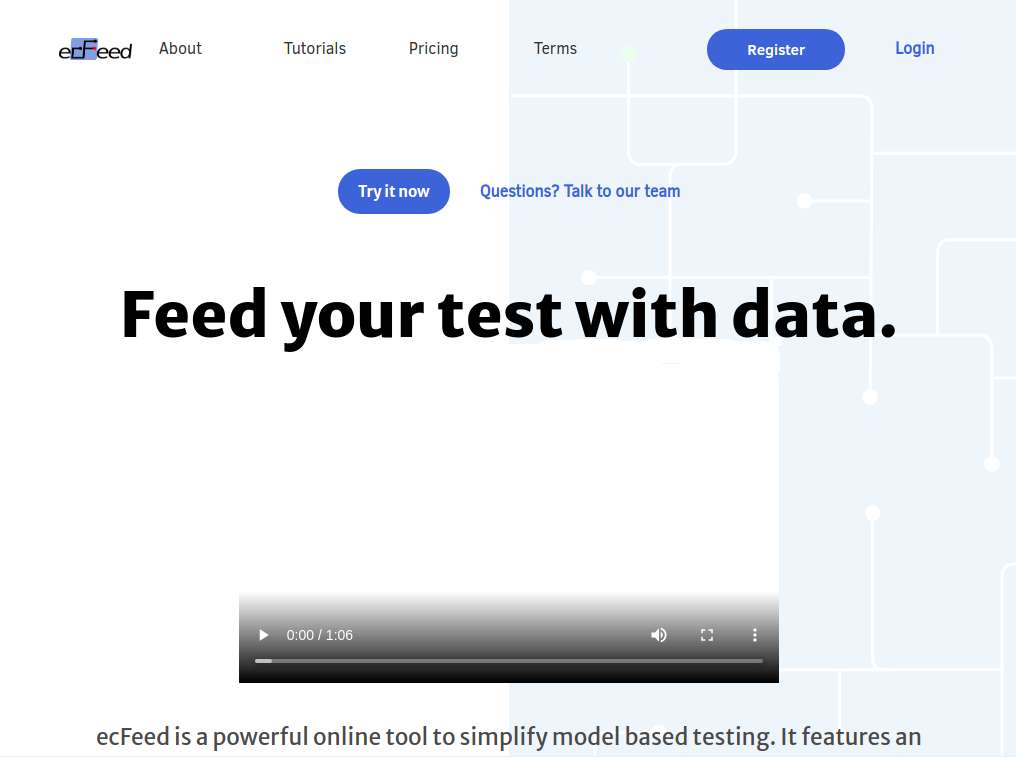
Registering a new user: Welcome page www.ecfeed.com > “Register” button.
Types of registration:
- By email.
- By credentials provided by Google. In this case an active Google account is required.
Registering by email
Registering using email: Welcome page > “Register” button > “Sign Up” button.
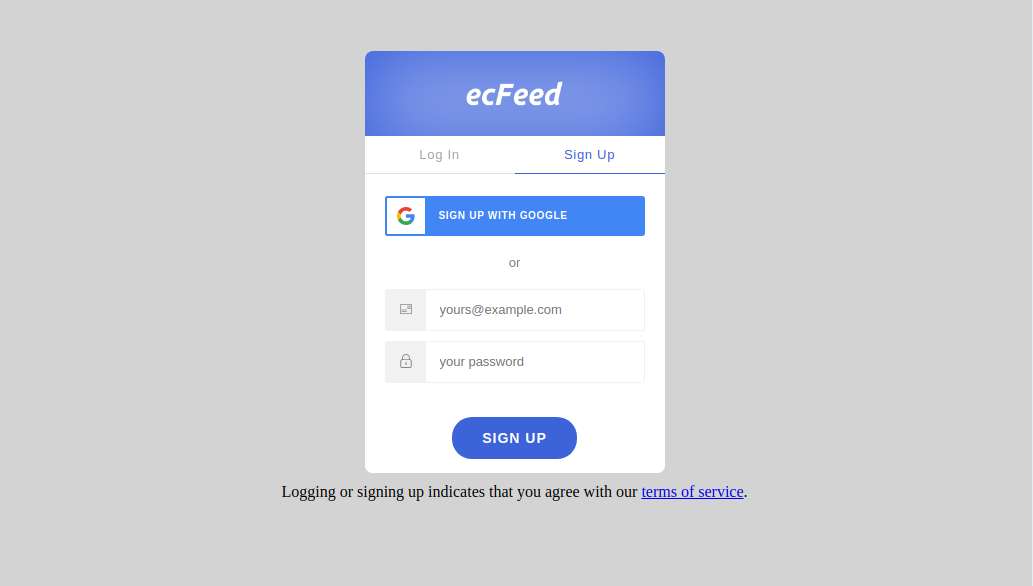
Email has to be verified. System sends a verification email to user’s mailbox. This email should be confirmed with click on “VERIFY YOUR ACCOUNT” button.
Registering using Google account
A new user can also register in ecFeed using Google account: Welcome page > “Register” button > “Sign Up” button > Click “SIGN UP WITH GOOGLE” button.
Startup screen
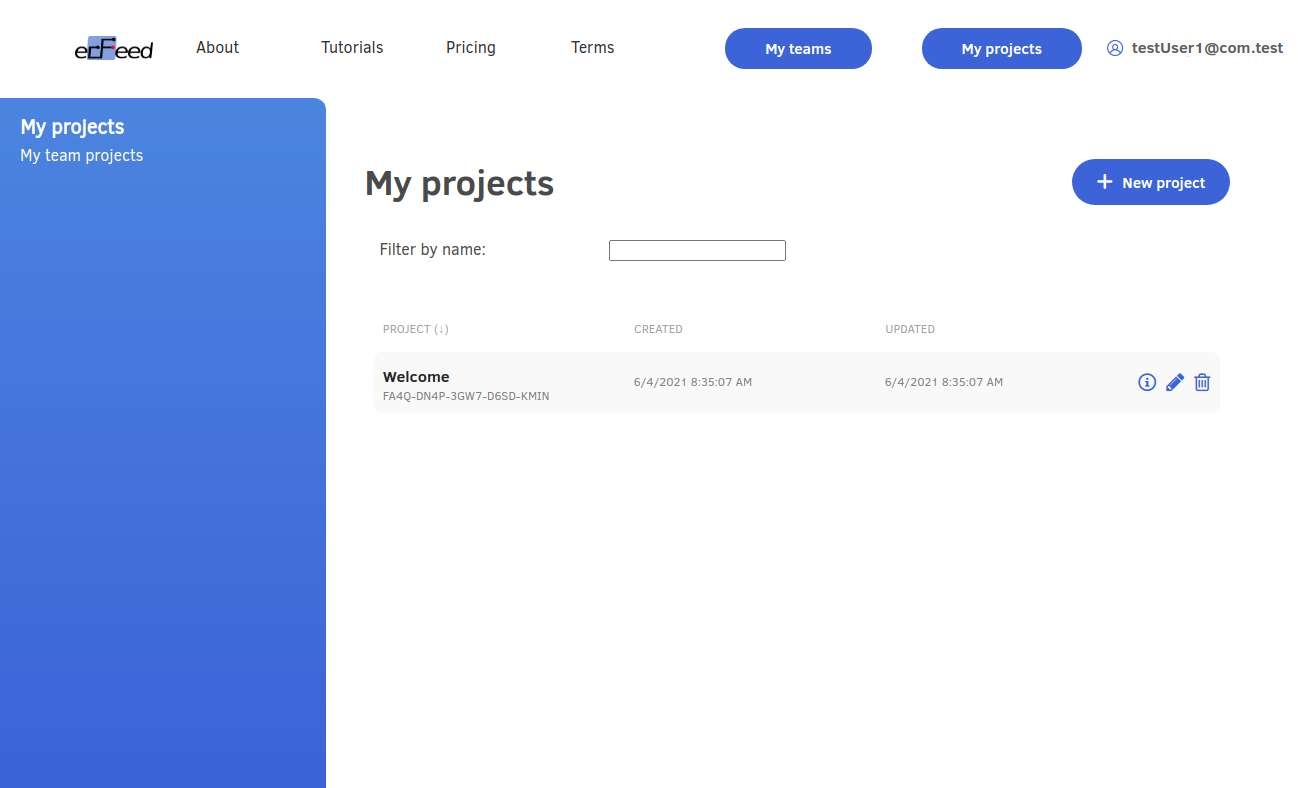
After login, an info about current user license is displayed.
Main menu is displayed at the top of the screen. Menu contains the following links:
- ecFeed - ecFeed startup page
- About - general information
- Tutorials
- Terms – terms of use
There are also two buttons:
- My teams – access to team management (described in "Team work" documentation )
- My projects – access to users own projects
In the top right corner user’s email is displayed.
In the main area below the main menu a list of “My projects” is displayed.
My Projects
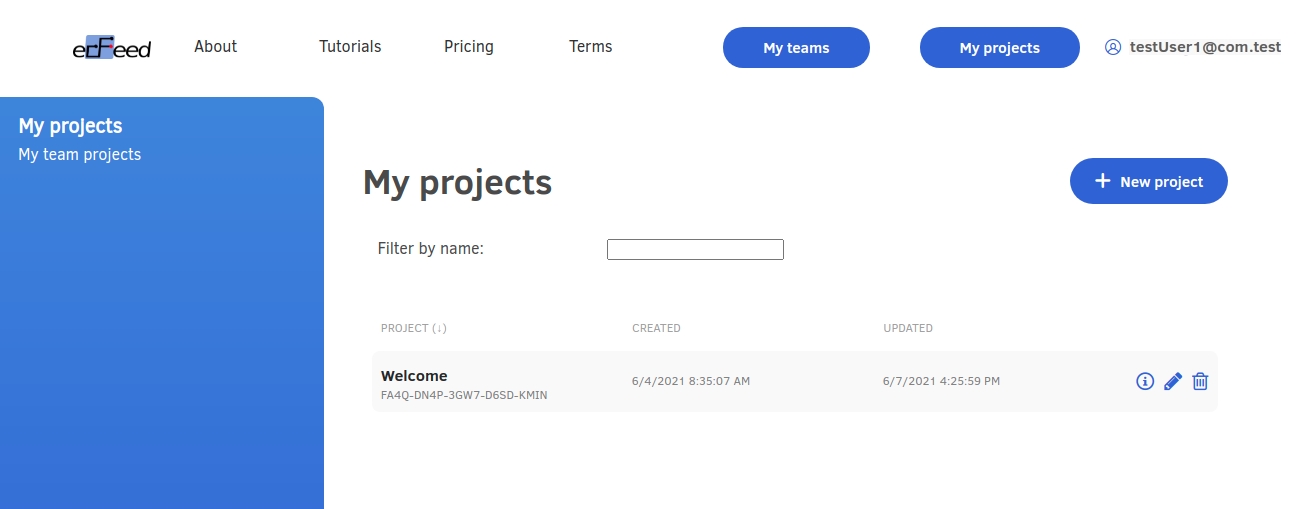
The list “My projects” displays projects created by the user. Initially there is only one Welcome project which was added by the system in order to provide a startup example.
Project description contains the following elements:
- project name (in bold font)
- project unique identifier
- “CREATED” - when project was created
- “UPDATED” - date and time of last project modification
- Insight icon “i” - displaying results of test executions
- Pen icon – renaming the project.
- Bucket icon – deleting the project
The projects can be filtered by project name using field “Filter by name” at the top of section "My projects".
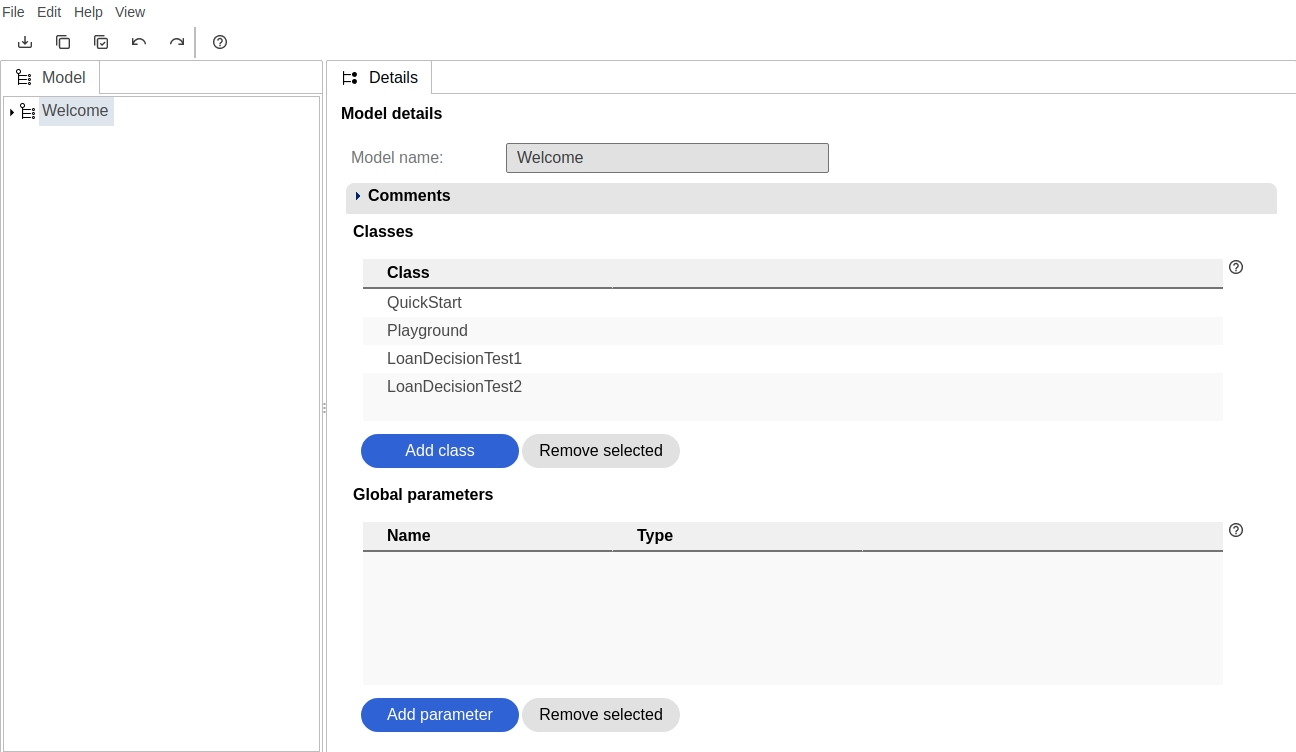
Click on the name or identifier of the project opens model editor. Data modelling with the use of model editor will be covered in Data Modelling tutorial.
Logout
Logging out: Move mouse over user’s email in the top, right corner > click “Logout” button (from drop-down menu).
Settings
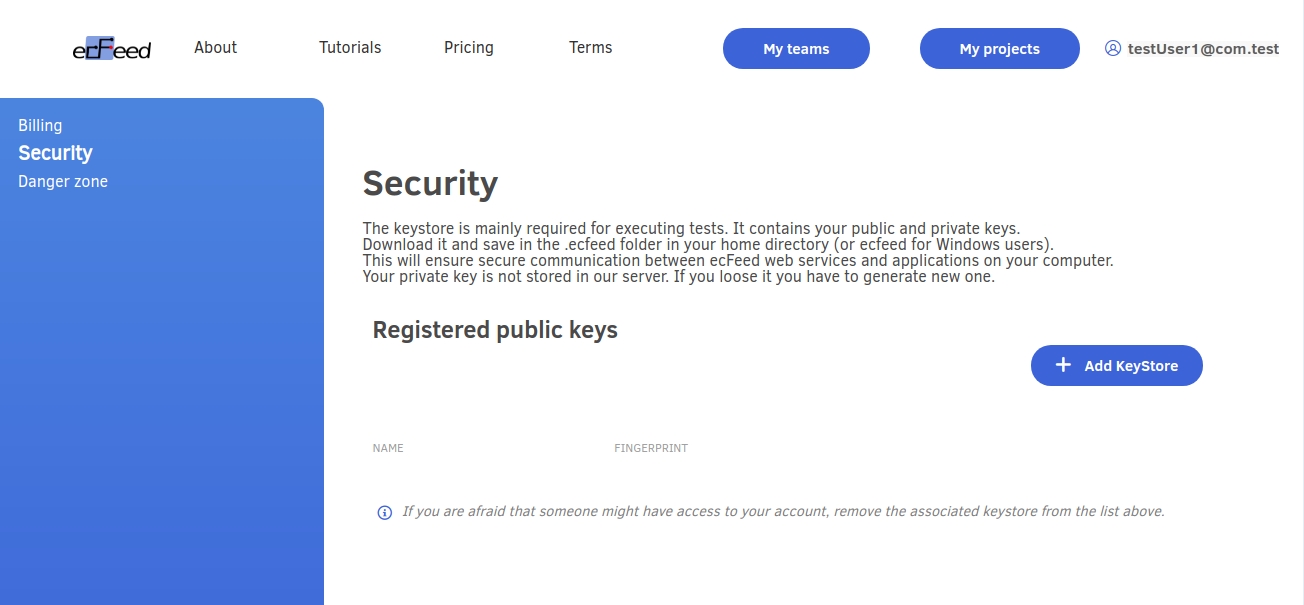
Displaying settings: Move mouse over user’s email > click “Settings” button (from drop-down menu).
The blue tab on the left show available pages: “Security”, “Danger zone”.
Security
Security settings are used to execute tests. This topic will be described in another tutorial.
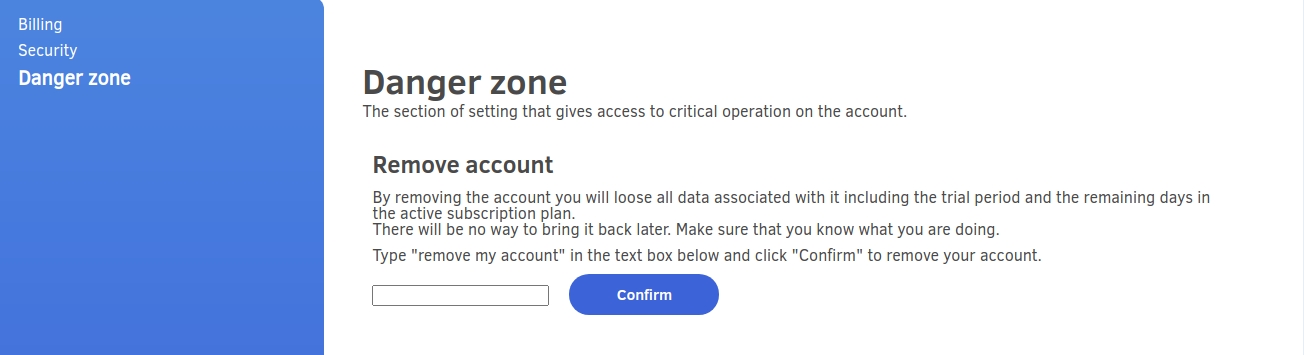
Danger zone
Danger zone page is used to delete user’s account. Together with the account all user’s models will be deleted.
Insight
Insight pages allow to analyze the results of test executions. Insight data can be added to the system separately to each project during execution of generated test.
Generation of tests and sending execution data back to the system will be described in integration tutorials (Integration with Java, C#, Python etc).
Displaying the insights for test project: Main menu > click My projects > click icon “i” in list of projects. The system will display the results of test executions.
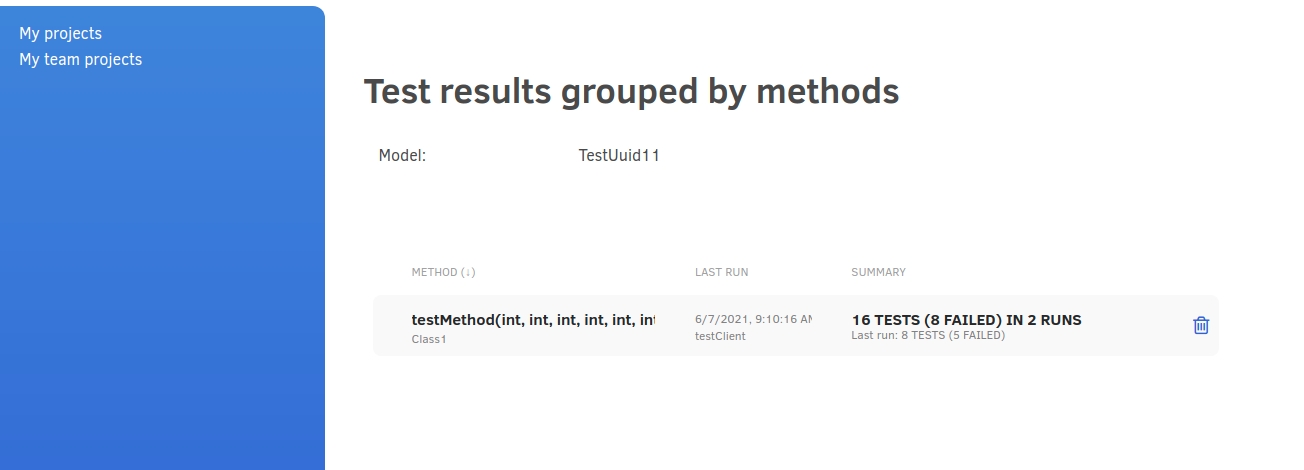
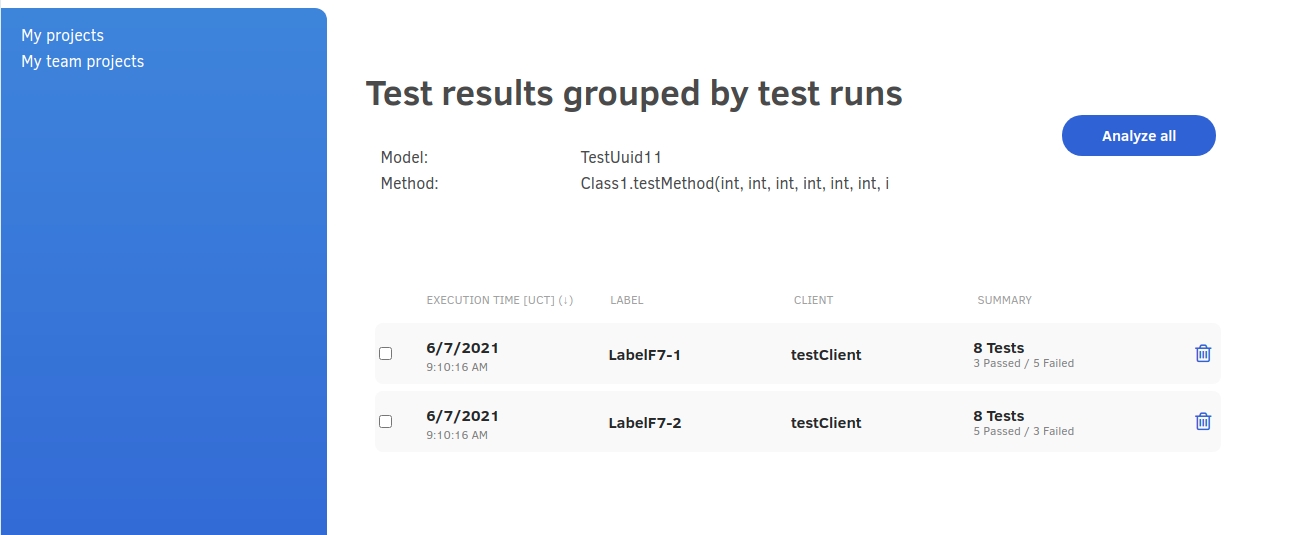
At the top level of data aggregation test results are grouped by methods.
Click on method name to see a more detailed view of test results grouped by test runs.
Analysis of test execution data
Analysis helps to diagnose the cause of test failures, that is the combinations of test input parameters which failed most frequently.
Displaying analysis: “Test results grouped by test runs” > button “Analyze all”.
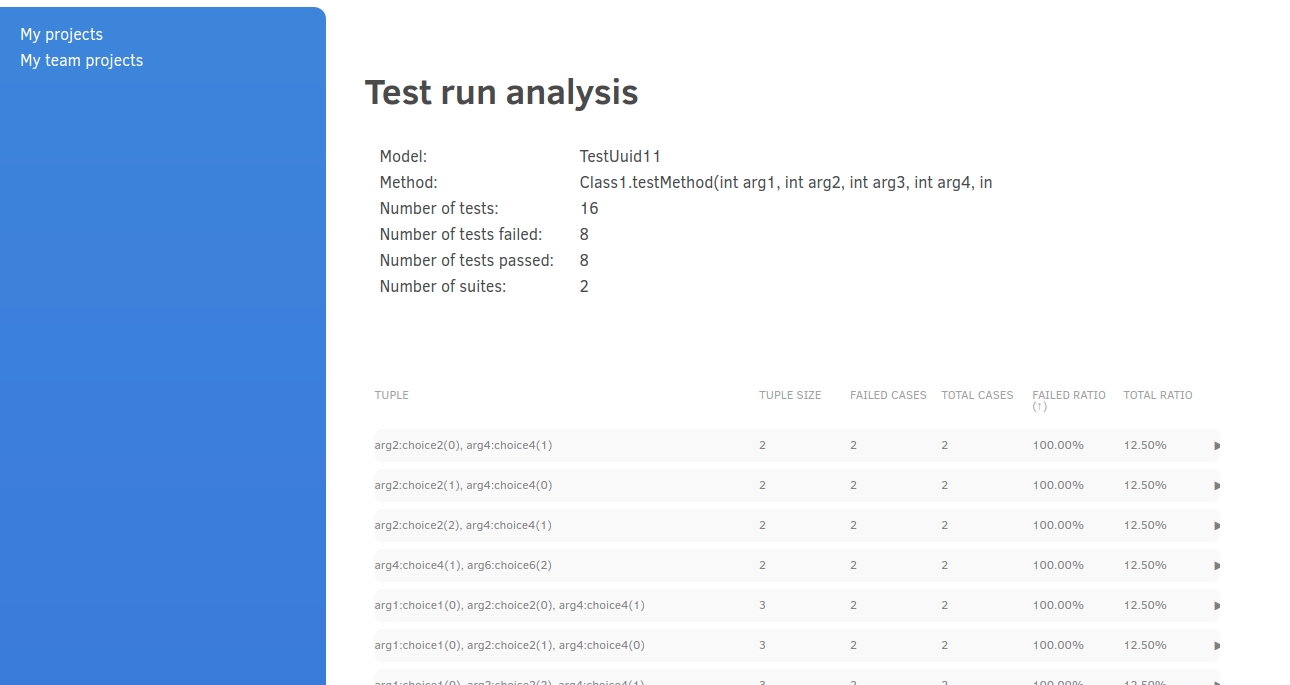
The results of analysis are initially ordered by failed ratio (number of fails/number of runs). This shows which combination of parameters failed most frequently. The results include combinations of values for pairs of parameters, 3-tuples etc.